The process
1. Discover
1.1 Workshops with stakeholders
We had an initial meeting with the clients in which we did a couple of workshops to define the main goal for the project and to identify their expectations as well as the risks of the project, the main actors and users involved in Aragon's demographic observatory.
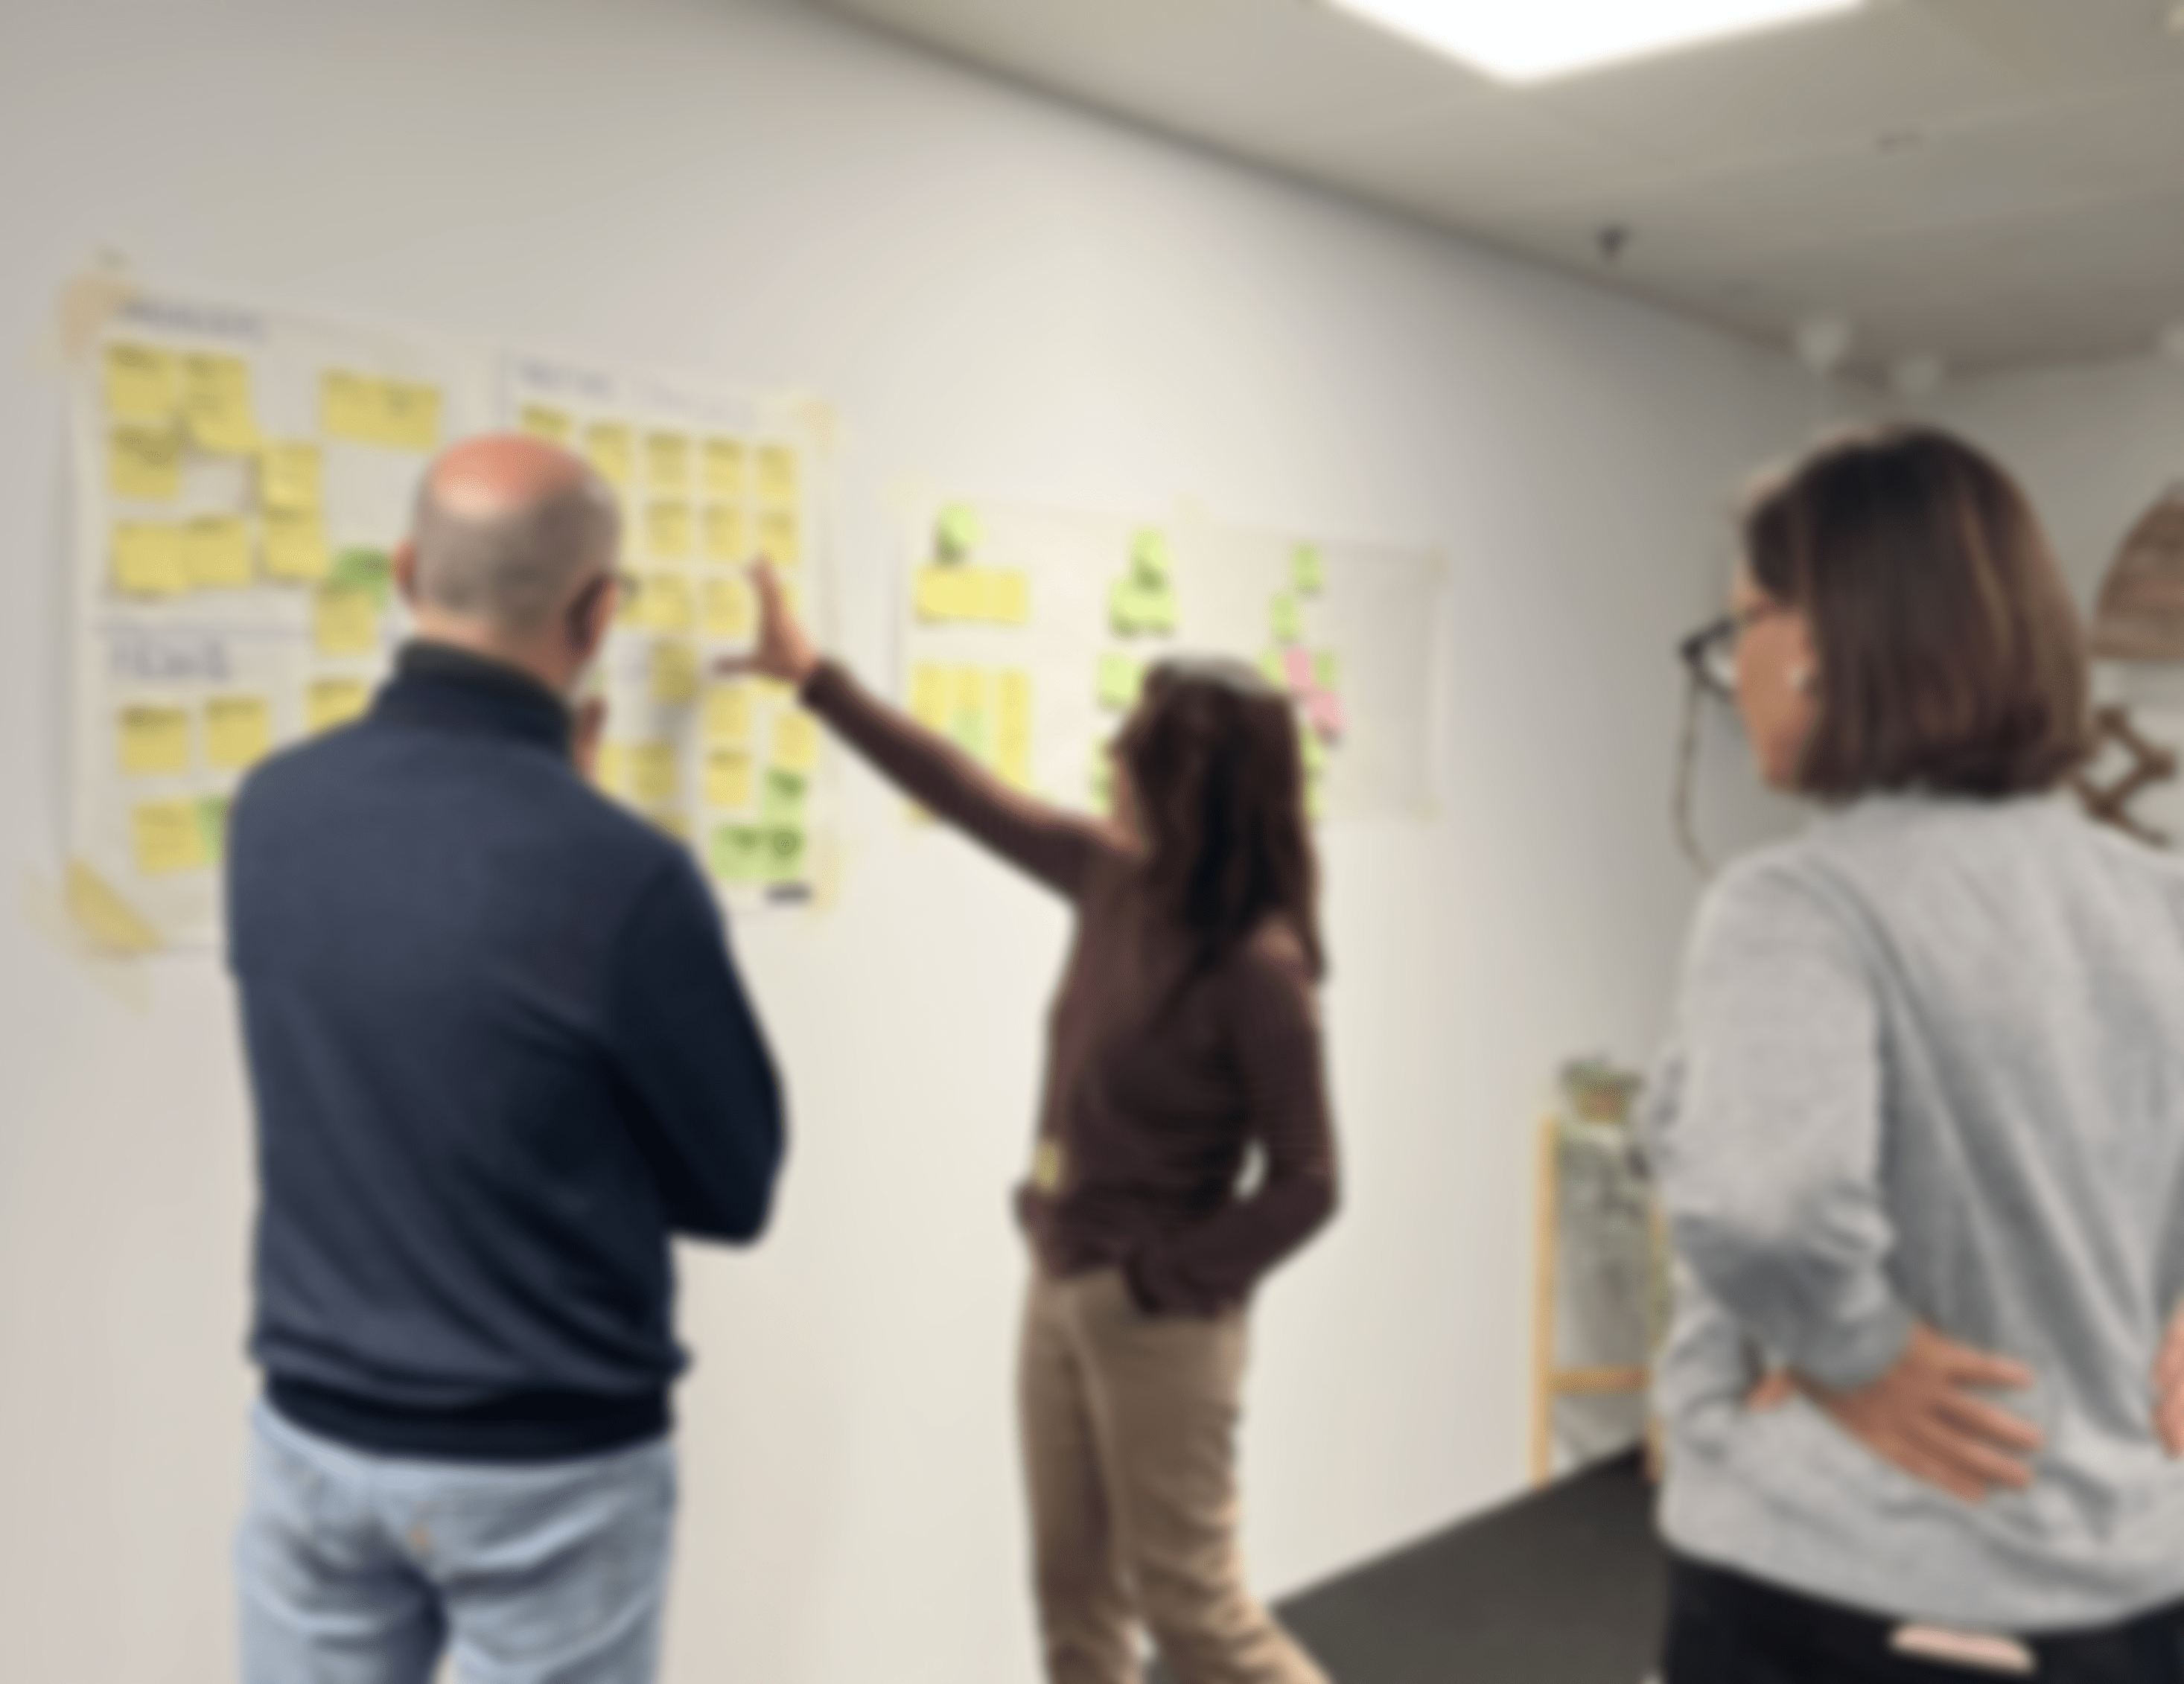
Image of the stakeholders during the workshops.
1.2 User research
Once the main users were identified, I conducted 12 interviews with the 3 main groups of potential users of the new demographic observatory, identified during the workshops with stakeholders:
- 4 Members of the Aragón's demographic observatory.
- 4 Members of Aragón's local entities (towns, municipalities, regions etc.).
- 4 Citizens of Aragón (such as entrepeneurs, students and scientific investigators).
I opted for interviewing users because it seemed the fastest way to empathise with them and also because I could clarify ambiguities with follow-up questions right away.
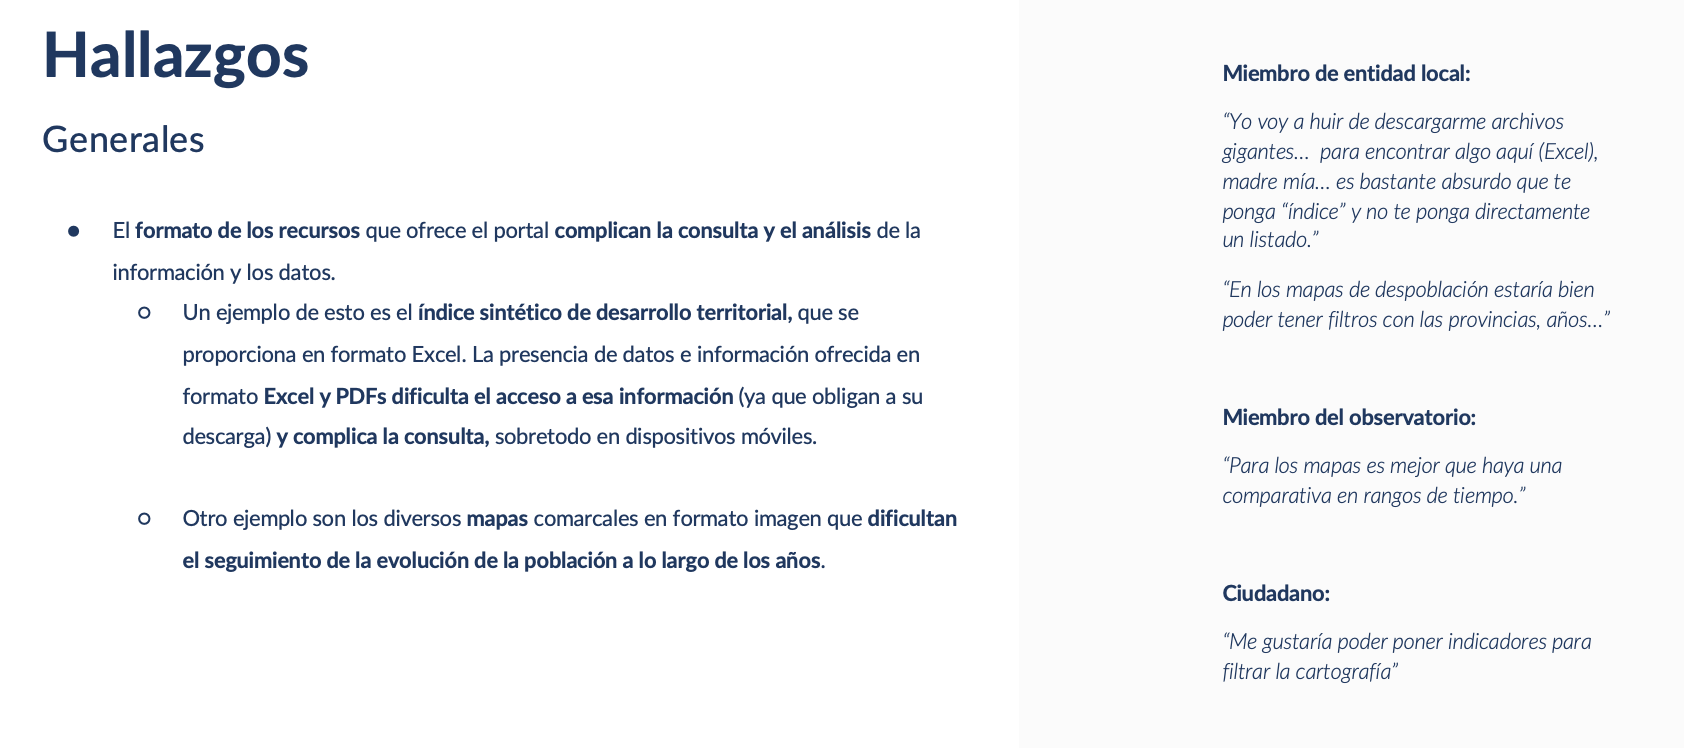
Screenshot of the interview report delivered to the client
2. Define
From the interviews's insights, I was able to define the design challenges for the demographic observatory.
Design challenges
Based on the findings, design challenges were generated. These design challenges helped me finding solutions to the specific problems of this portal, managing to add value to the user experience.
- How might we offer useful information to users of the demographic observatory?
- How might we create an intuitive portal where users can quickly find what they are looking for?
- How might we transform the observatory into a two-way channel that allows any citizen to make contributions?
- How might we make the demographic observatory portal known to citizens?
- How might we optimize the resources offered on the observatory portal so that they are useful to users?
- How might we separate the public activity of the observatory from the confidential one directed exclusively to members?
- How might we encourage the use of the portal by local entities, beyond the request and justification of subsidies and financial aid?
3.Prototype
3.1 Information Architecture
Prior to designing the demographic observatory portal, the information architecture was defined in Whimsical.
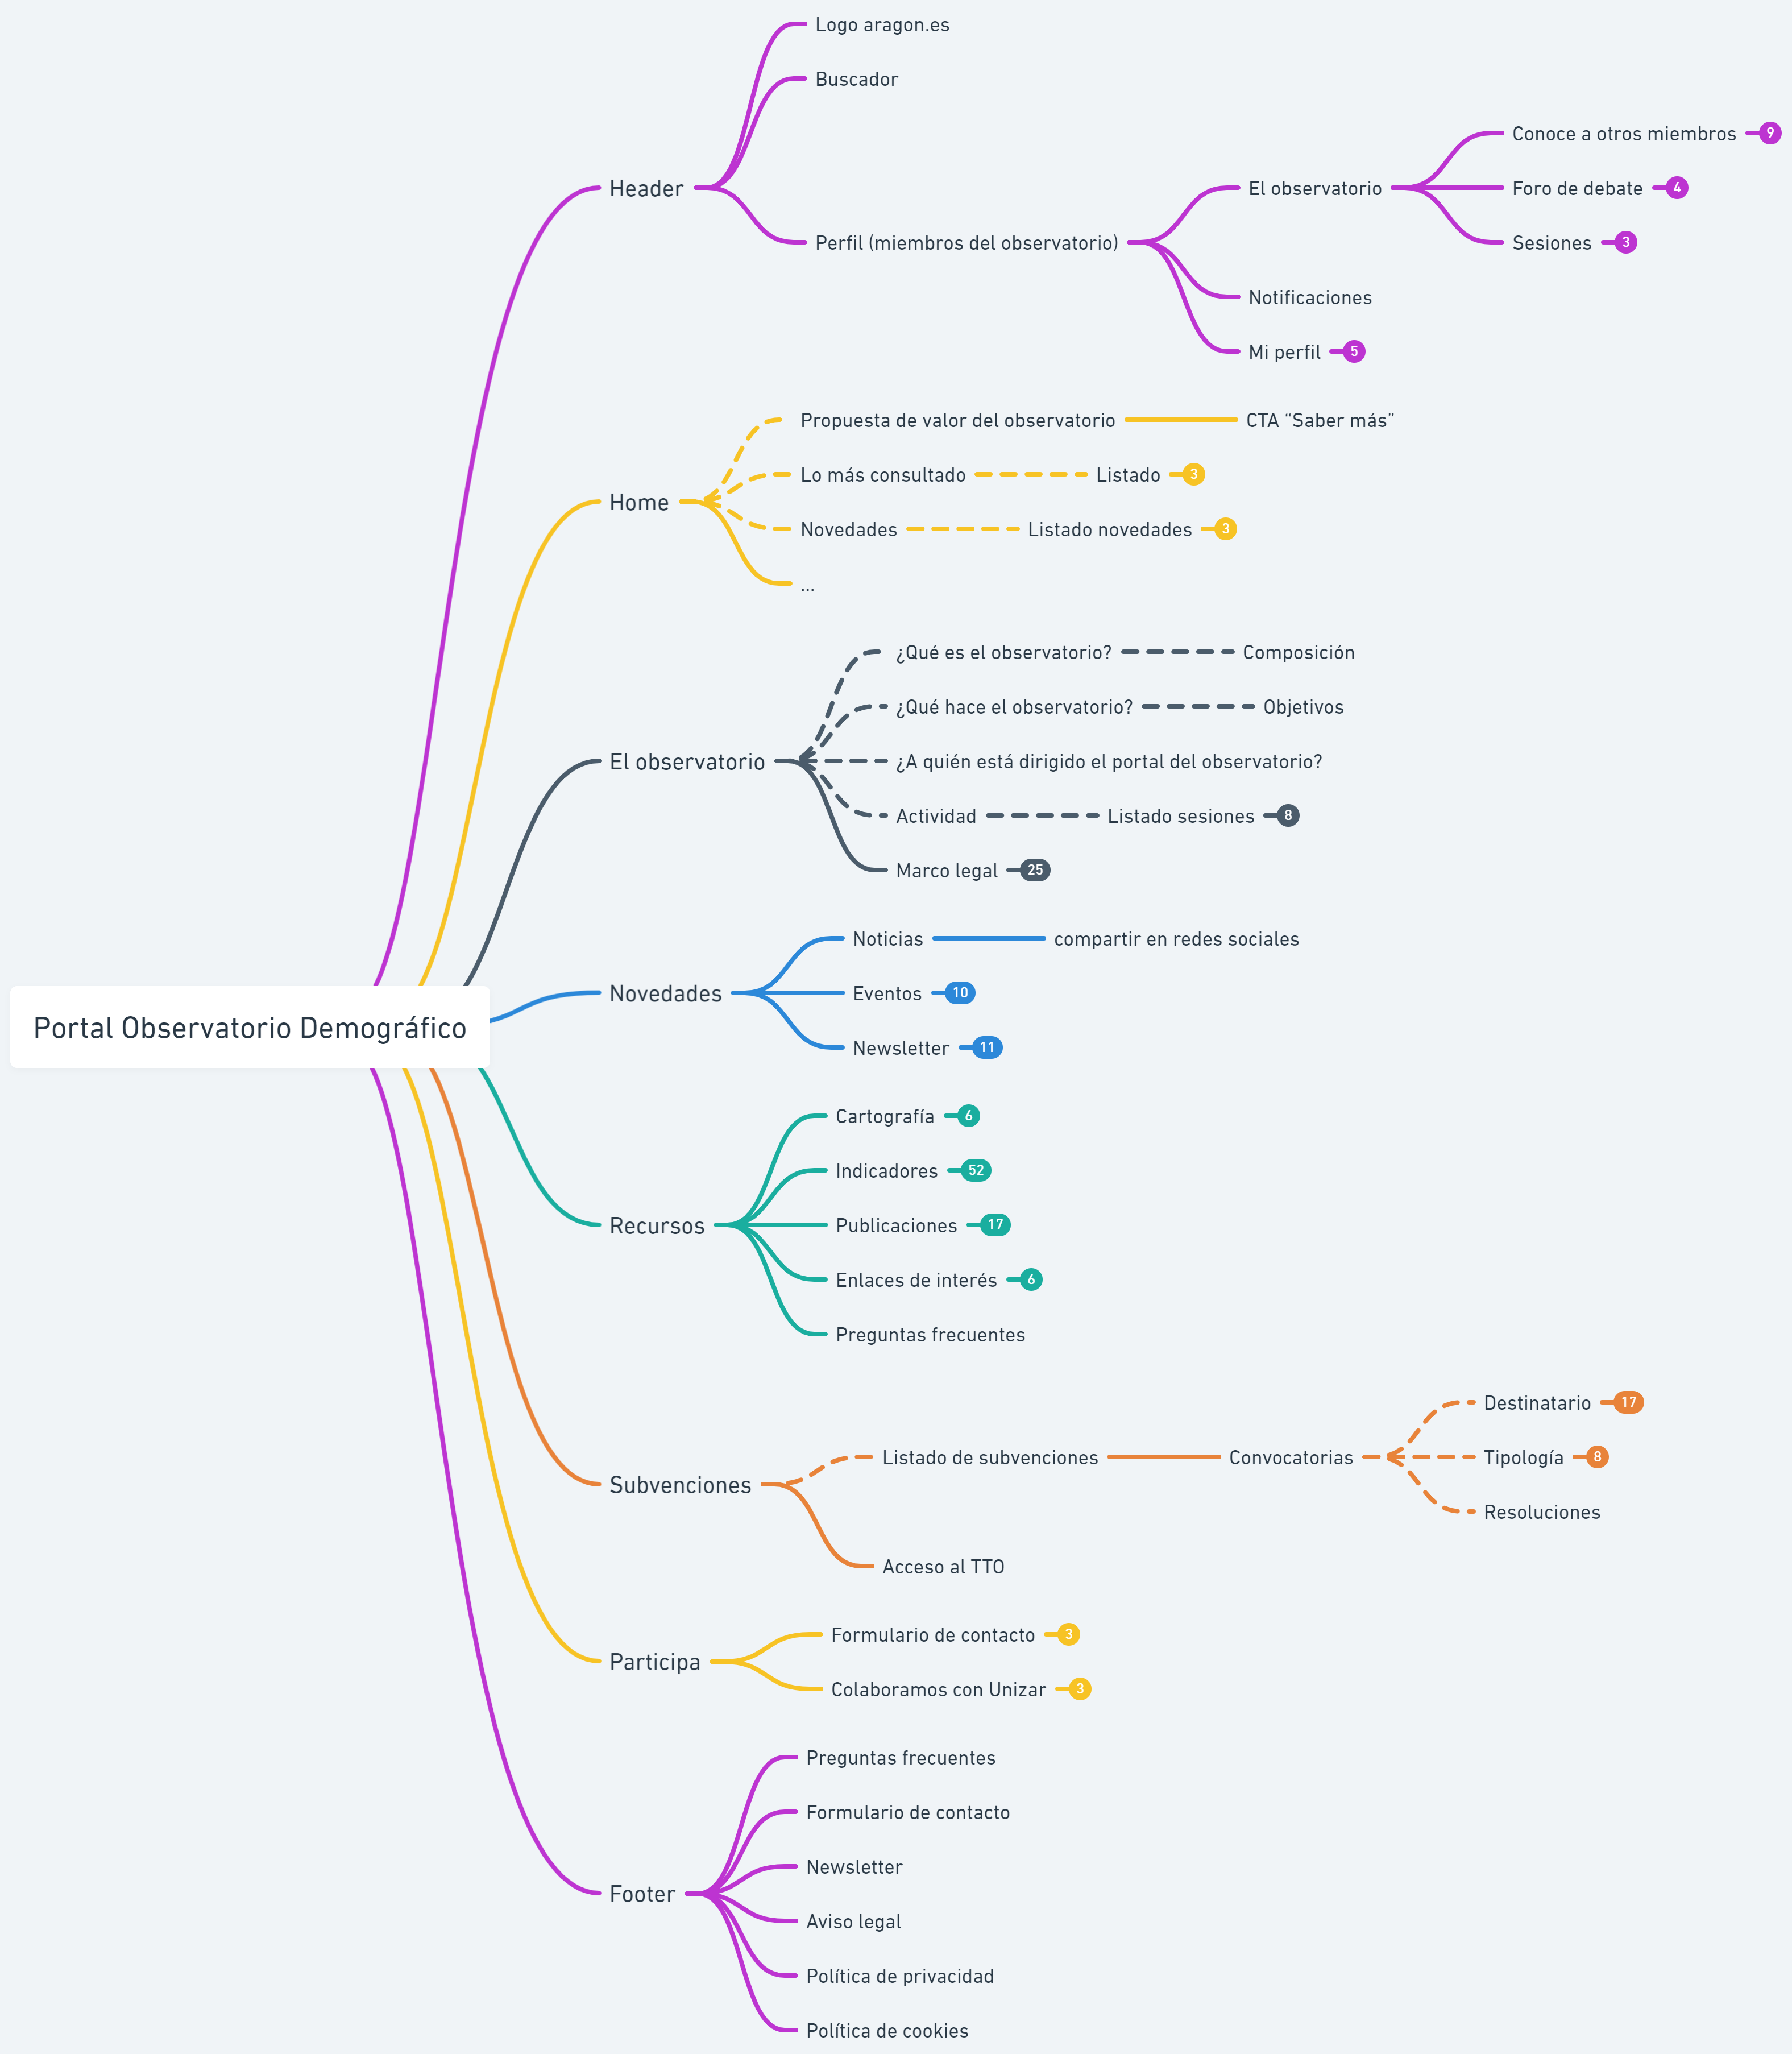
Information architecture done in Whimsical.
3.2 Prototyping
As this is a digital space within the Government of Aragón, I had to use DESY, which is the design system this public administration follows since 2021, with the aim of achieving a visual unity that provides identity.
I used Figma as the prototyping tool and followed a desktop-first approach, since this was the most used device for the visitors of the demographic observatory.
In Spain, all public administrations must obtain at least AA in terms of accesibility, so I collaborated with an accesibility expert who checked my prototypes and the necessary modifications were made in order to meet accesibility requirements.
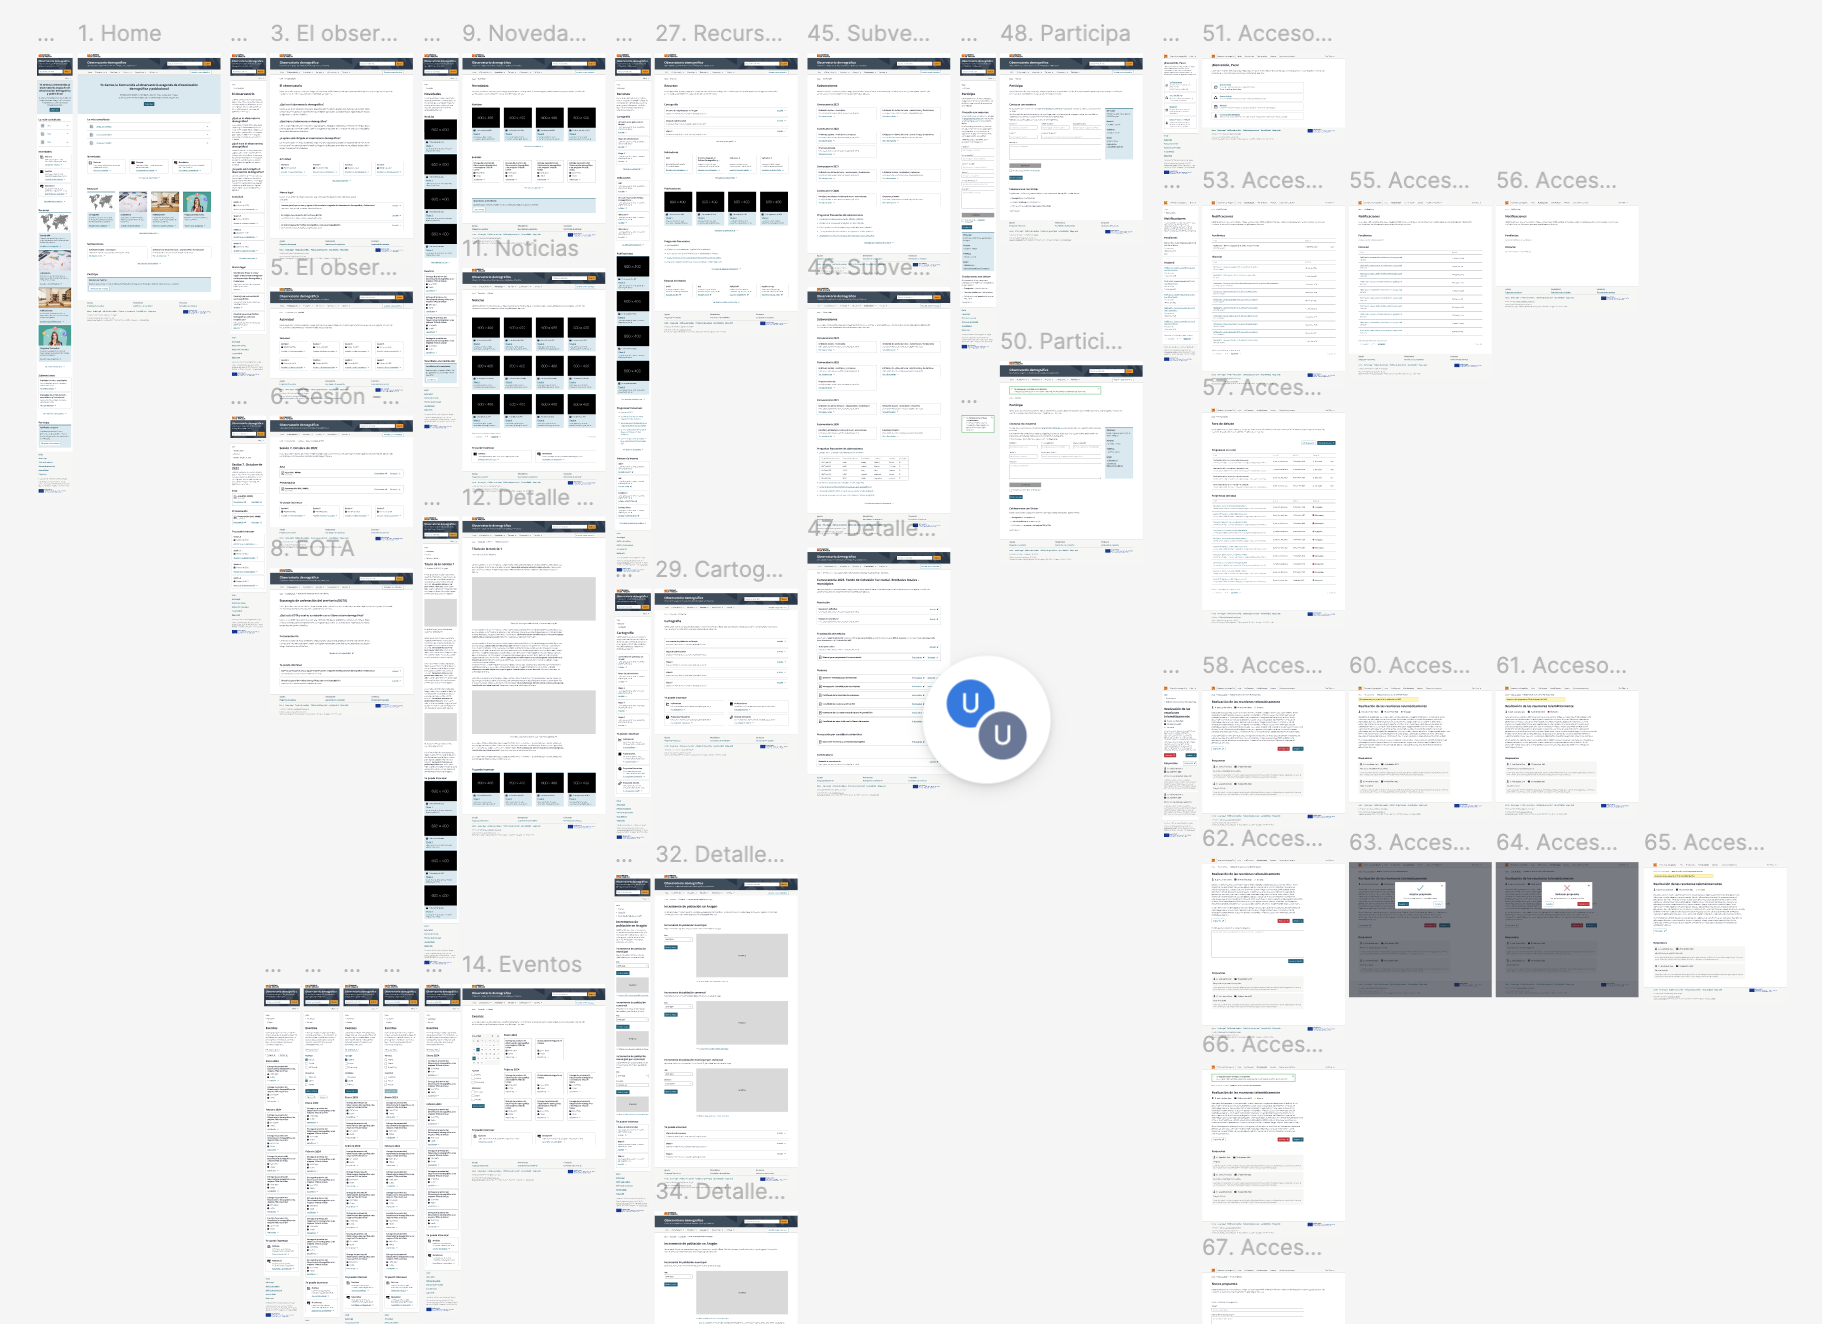
Image of the workspace in Figma.
The prototype was presented during a session of Aragon's demographic observatory and it was valued in a very positive way.
It was published on DESY's website as an example of a good usage of DESY's design system.
Next project
UX research tool ›